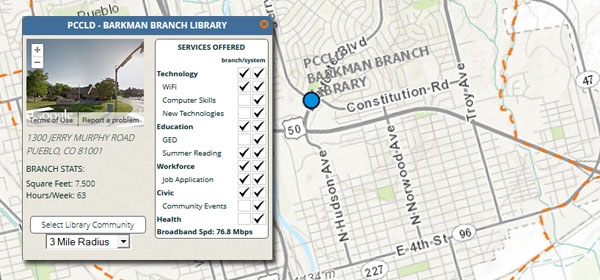
The first Digital Inclusion Survey—conducted by the ALA Office for Research & Statistics and the Information Policy & Access Center (iPAC) at the University of Maryland—captured public library services related to digital literacy, economic and workforce development, education, health information, and internet access. Its overall goal is to highlight the role public libraries play in building “digitally inclusive communities.” (If this sounds familiar, the Digital Inclusion Survey picked up the reins from the Public Library Funding & Technology Access Survey, or PLFTAS.)
The 2013 Digital Inclusion Survey closed late last year, and researchers hope to release their national data report during ALA’s Annual Conference in a few weeks. In the meantime, we are having a blast playing around with the national interactive map. It combines demographic, economic, and health data from the American Community Survey and select Digital Inclusion Survey results to illustrate what libraries offer their communities and general attributes of those communities as well. Even better: iPAC is adding features to allow users to print pieces of this excellent tool. And if you’re looking for more help to tell the story of your 21st-century library, check out the issue briefs and map visualizations.
We’re looking forward to seeing the final results from this new survey!