Ithaka S+R recently published the results of their Library Acquisitions Patterns project, which examined purchasing trends in U.S. academic libraries. Their analysis focuses on print books, journals, and ebooks purchased at 124 participating academic institutions.
Total materials spending by the participating academic libraries rose by about 8% between 2014 and 2017 to over $313 million. One-time resources (single books and ebooks) accounted for about 1 in 5 (16-21%) information materials purchased from 2014-2017, while ongoing materials like journals made up most of the remaining materials (70-76%). However, library spending is not rising as quickly as the prices for these materials – the average cost for an ongoing resource was well over a third (37%) higher in 2017 than in 2014.
Spending on print books declined by 12% during the four years tracked in this study, which was reflected to some extent in each disciplinary field. Spending on print books in STEM disciplines dropped by a quarter (25%), which was the most prominent reduction. Spending on print books in humanities and social sciences dropped by much less over the same period (7% and 8%, respectively).
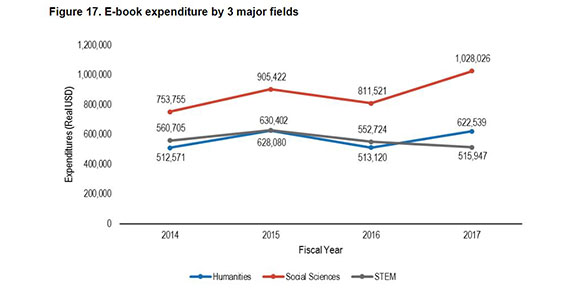
Spending on ebooks rose by 9% from 2014-2017, although ebooks still only make up around 1% of total library materials spending. Ebook purchasing increased the most for social sciences materials (by 7%) and humanities materials (by 2%). Like with print book purchasing, ebook purchasing for STEM disciplines dropped by about 8% from 2014-2017.
GOBI Library Solutions was the largest vendor of print books and ebooks to the participating academic libraries during the time of the study, providing three-quarters (75%) of print books sales to the libraries by 2017. Amazon was the second largest vendor, hovering just below a tenth of libraries’ print book sales (8.2% in 2014 to 7.1% in 2017). GOBI was also the dominant vendor of ebooks to the libraries, providing 9 in 10 (90%) ebook sales. The next-largest ebook vendors to the participating libraries were Springer (1.8%) and ProQuest/Coutts (1.5%).
You can find the entire report here.
Note: This post is part of our series, “The LRS Number.” In this series, we highlight statistics that help tell the story of the 21st-century library.