Introducing the 2025 PLB Expansion Pack!
After two years (it’s been two years already?!) of Public Library Blueprints (PLB) posts, we at Library Research Service (LRS) wanted to make sure this blog is serving the library community to its full potential. So, just as you might expect from a research service, we ran a survey! Thank you to everyone who filled out this survey on LibWizard, and if you haven’t already, we’d still love to hear from you!
Survey responses revealed a variety of different topics of interest including but not limited to: mapping data, statistical tools, new resources, research best practices, guidance for data-driven decision making, improving access to data, linking internal and external data, and continuing the current PLB series. With all the great feedback and new ideas, we’ve got a lot to cover in 2025. To tackle these topics, we’ll continue the Public Library Blueprints while incorporating new content from different platforms, and we’ll feature projects by team members from LRS and the entire Colorado State Library where data-driven decision making was key.
Where to Begin
Respondents to the 2025 Library Research Service Blog Feedback Survey selected “Mapping data: CO demographics, socioeconomic data and more by location” as a topic of interest more often than any other topic listed. As it happens, LRS recently purchased a license for the software PolicyMap to bring community insights to libraries by mapping out relevant, location-specific data. To introduce this new-to-LRS tool, let’s take a look at one of the first maps created by LRS, which is a public map of all the Colorado library locations.
While this is far from the first map of all Colorado libraries, what makes this one particularly interesting is the overlays that users can customize. Anyone can access the map and have free access to numerous overlays which include everything from the locations of small business development centers or environmental disaster/risk sites, to home values, the percentage of people living in poverty, or median age and much more. We’ll dive a bit further into some options that PolicyMap offers for both nonsubscribers and subscribers below. But first, let’s take a look at the library locations themselves (indicated by a red triangle on the map) and how to use this element of the map.
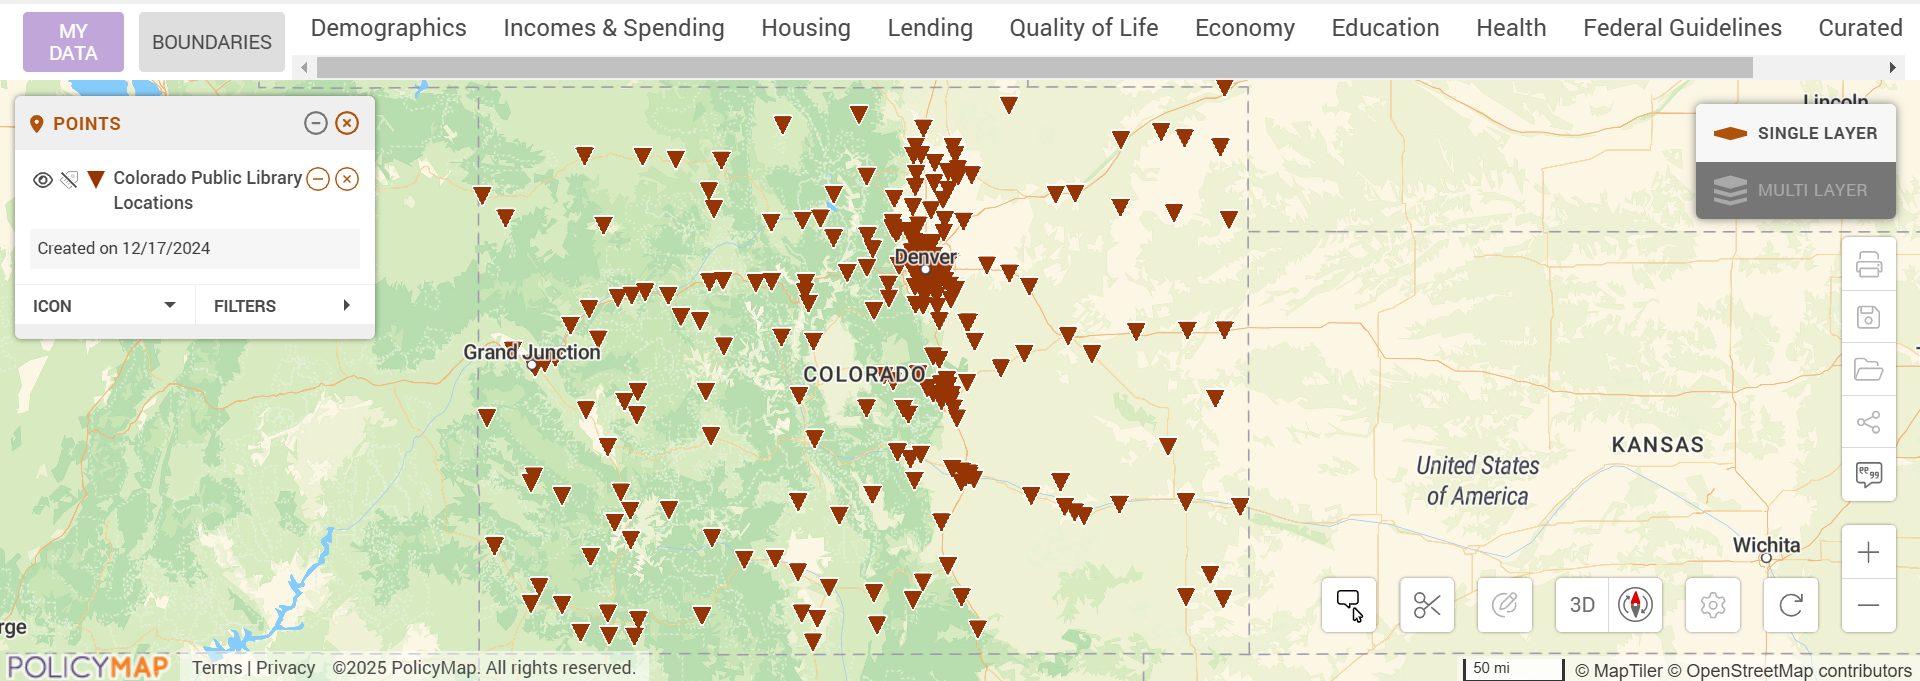
When the link to this map is first opened, the map will look similar to Figure A above. There may be notifications regarding updated data or the features available at your subscription level, which can be closed to show more of the map. Hovering over a red triangle reveals the name of the library at that location, and clicking on it brings up more information such as the library’s address, the name of the library system, and its phone number. Library systems can be filtered so only locations belonging to the selected systems appear. To filter by system, expand the filters option in the “Points” toolbox on the left of the screen (circled in red on Figure B) and select the library system or systems that you would like to appear on the map as shown in Figure B.

Users can also adjust the map view by clicking and dragging the map and zooming in and out (using the plus and minus symbols on the bottom right corner of the screen) to get a better view of the specific library system/systems of interest.
Your Turn!
There are many additional layers that can be added to this map to learn about the areas and communities our libraries serve. We hope you are able to take some time to explore this external data to learn about aspects of your community and help your library meet its unique needs. To add an overlay to this map, choose one of the categories from the toolbar above the map (such as “Demographics”, “Incomes and Spending”, or “Quality of Life”) then select the subject you are most interested in. Once the overlay is loaded onto the map, you can make minimal adjustments depending on your selection. For example, some overlays have a “Variable” option in the left toolbox that allows users to change whether the information is conveyed as a percent, a number, or a percent change. The shading applied to the map in Figure C below indicates the percent of people living in poverty (2018-2022).
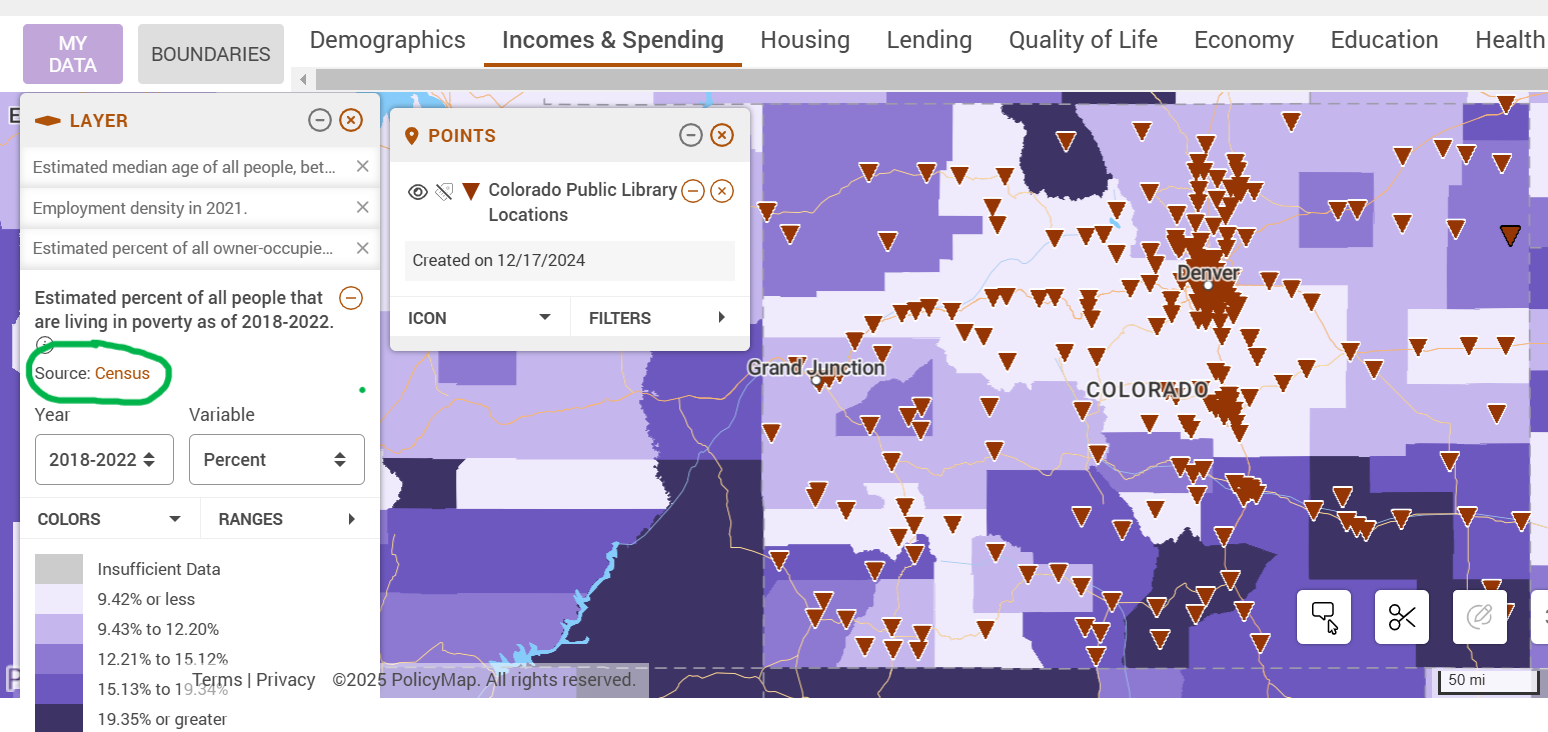
Zooming in and out changes the detail level of the overlay. The layers that were previously applied to the map in Figure C are listed above the current layer in the “Layers” toolbox, but are greyed out because they are not currently applied to the map. This makes it easy to toggle back and forth between layers with a single click. It is also important to note that you can learn more about the data you are looking at and even find information about the data set by clicking the link next to “Source” (circled in green in Figure C).
There’s a lot to learn in PolicyMap, and so don’t be afraid to click around and explore. We can’t cover all the features in this post, but if you would like to learn more, PolicyMap provides resources including this short PolicyMap Quick Start video.
Behind the Scenes
As you explore this tool, you’ll likely run into many features, customizations, and overlays that ask you to sign in in order to gain access. Options are limited for people that don’t have an account, but LRS has full access and is excited to continue exploring this new tool and sharing findings that help support Colorado libraries.
One such feature for which access is limited to account holders is the “Reports” option when a library location is selected. This option lets users set a distance around a location or select a predetermined boundary (such as a city or county) and then generates a community profile for that area. This community profile includes information on population trends, racial characteristics, age distributions, incomes, housing types and more. If you do not have an account and can’t find what you are looking for in PolicyMap, please don’t hesitate to reach out to LRS through lrs@lrs.org. We would love to help you find what you are looking for if at all possible.
There’s More Where That Map Came From
At LRS, we’re still in the initial stages of discovering all that this exciting new tool has to offer. This first map of library locations is just a sneak peek into the many intriguing maps that have been and are in the process of being made. We’re excited to use this blog post as a platform to highlight the exciting creations within this software that are still to come as well as the data tools we’re building in different platforms such as Tableau. We hope you’ll stay tuned in throughout the year and take full advantage of the data tools we have to offer!
LRS’s Colorado Public Library Data Users Group (DUG) mailing list provides instructions on data analysis and visualization, LRS news, and PLAR updates. To receive posts via email, please complete this form.