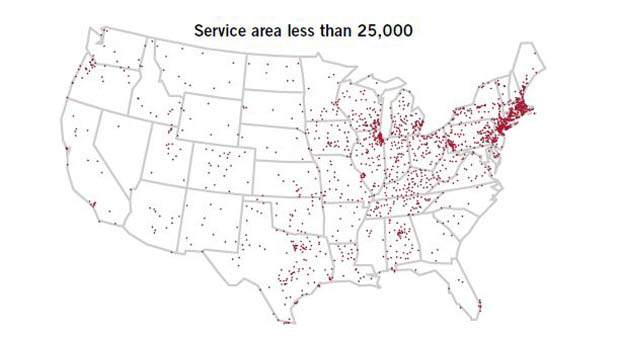
What’s not surprising: rural and small libraries provide critical resources and serve as community anchors to populations of less than 25,000 and non-urban areas. What is surprising? That small and rural libraries make up more than 80 percent of U.S. libraries as of Fiscal Year 2011, according to the Institute of Museum and Library Services (IMLS) brief, “The State of Small and Rural Libraries in the United States.” Across the country, more than 3 out of 4 public libraries serve communities of less than 25,000 people, and nearly half of all U.S. public libraries are in rural areas. The breakdown of “small” and “rural” in Colorado’s 114 public libraries follows fairly closely to national numbers: 54 percent of public libraries are rural while 76 percent are small, according to the IMLS data. (It is important to note that while most rural libraries are also small, not all small libraries are also rural. Get more details about these differences, as well as the breakdown of subcategories within these identifiers, in the full IMLS briefing.)
As might be expected, rural areas have more difficulty obtaining broadband access than their urban counterparts. However, rural libraries are working to ease this divide by increasing the number of public access computers (see the Colorado State Library’s BTOP project for an example of this), up more than 20 percent across 3 years (FY2009-FY2011). Across the same time period, small libraries have had a similar increase in the number of public access computers (18%). Interestingly, libraries serving communities of less than 25,000 provide 21.1 million e-books to their users, or 60 percent of all e-book holdings in the U.S.
And it’s not just technology: both rural and small libraries have seen increases in overall circulation and visitation from FY2009 to FY2011. In fact, visits per capita are higher at rural and small libraries—7.6 visits per year and 5.5 visits per year—than at their more urban and larger (serving 25,000+) counterparts at 5.7 visits per year and 4.5 visits per year, respectively.
Interested in showing how your small or rural library is making an impact? View your library’s annual statistics through our interactive tool, as well as state totals, averages, and ratios. And don’t forget other sources of public library data, such as the Public Library Funding and Technology Access study and the Public Library Data Service study, that also provide useful information.
Note: This post is part of our series, “The Weekly Number.” In this series, we highlight statistics that help tell the story of the 21st century library.
