Public libraries must make tough decisions about how to allocate limited funds to best meet their communities’ needs. These decisions take into account the responsibilities of maintaining a relevant collection, acquiring current technologies, and having the staff available to assist patrons and maintain technology. Examining the trends of key expenditure categories can give some insight into how libraries in Colorado adjust their spending over time to meet their communities’ needs.
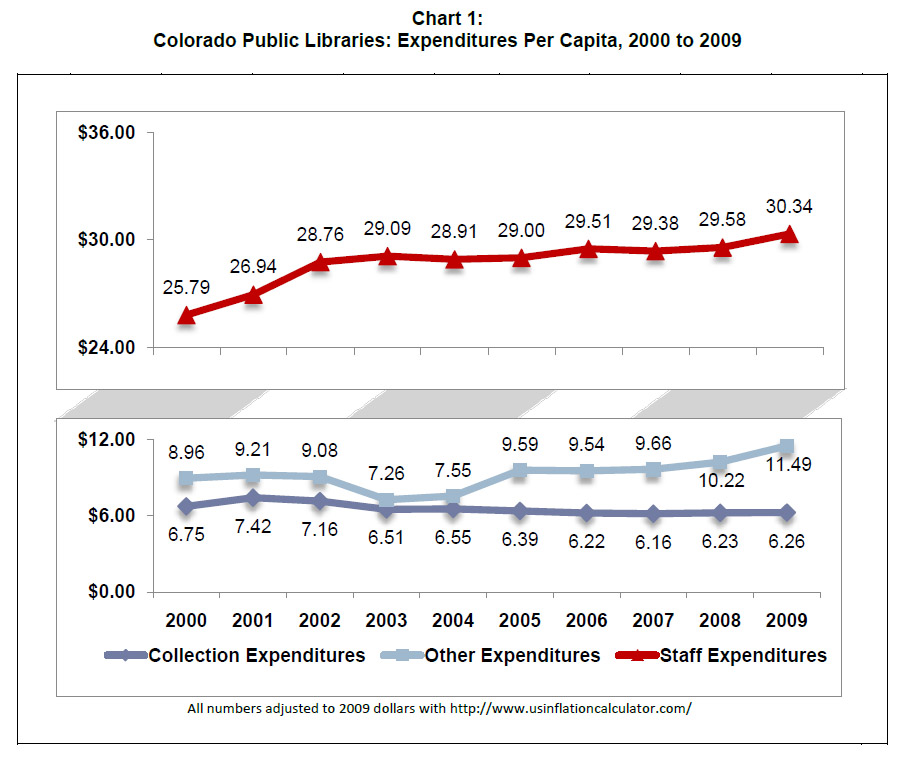
Library expenditures broken into three categories – collection, staff, and other operating expenditures (all adjusted for inflation)—show how public library funds have been allocated throughout Colorado as a whole between 2000 and 2009 (Chart 1). Collection expenditures per capita have gone down 49 cents over the past decade (-7%).
Staffing remains the highest expenditure of public libraries; per capita staff expenditures have grown by 18% between 2000 and 2009. However, that increase is modest when compared to the 28% increase in “other operating expenditures per capita.” This category covers a wide variety of costs, including technology and the additional costs associated with independent library districts (e.g., building maintenance, human resources, and other expenses that may have been previously covered by city or county services).
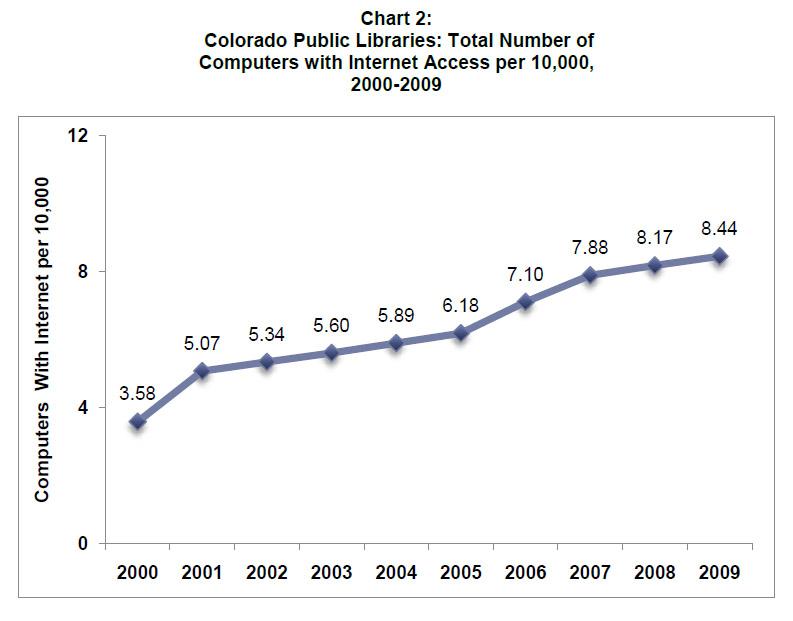
One factor that may be driving the increase in other operating expenditures is increased outlays for technology expenses. Between 2000 and 2009 the total number of public access computers per 10,000 served in Colorado public libraries more than doubled (Chart 2).
Libraries have increased the number of computers to accommodate the evolving needs of patrons as content is transferred to and purchased in digital formats. As the number of computers increases, libraries incur additional expenses for software, peripheral hardware, and other technologies associated with computers.
While the increase in the number of public access computers may account for some of the increase in other operating expenses, more data is needed to paint a clearer picture of what is driving the increases in this category and how libraries are allocating resources to meet operation and community needs.

